
Most organizations do not have a reliable baseline for coordination absorption. This estimator uses the 4M model to produce an executive-level CCR signal.
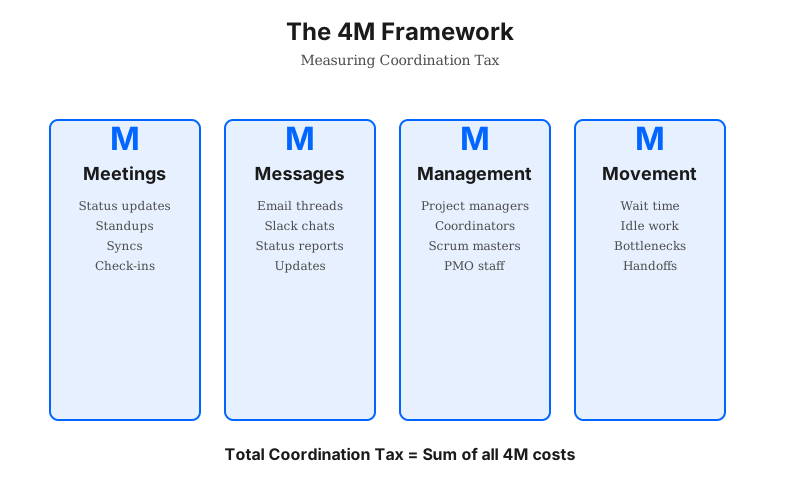
Coordination overhead comes from four sources:
- Meetings — Time spent in coordination meetings (standups, syncs, status updates)
- Messages — Time spent reading/responding to coordination emails and chats
- Management — Headcount dedicated to coordination (project managers, coordinators)
- Movement — Time work spends waiting vs. being actively worked on
CCR = (Total Annual Coordination Cost ÷ Total Annual Labor Cost) × 100
For formal CCR definitions, assumptions, and model tiers, review the Coordination Capital Ratio framework before using this estimate in planning discussions.
Calculate Your CCR
Enter your current-state assumptions below. Treat this as a structural baseline, then validate through calendar audits, time sampling, and role-cost classification.
CCR Estimator (4M Input Model)
Executives routinely underestimate coordination overhead by 30-50%. This estimator models how much operating capital is currently absorbed by human-mediated coordination.
Meetings
Messages
Management
Movement
Your CCR Estimate
$10,558
per week
$549,000
TACC estimate (annual)
35.2%
Coordination-constrained
Interpretation
Band: > 35%
Classification: Coordination-constrained
Estimated TALC baseline: $1,560,000
CCR is a structural indicator, not an accounting metric. It is designed for architectural diagnosis, not statutory reporting.
What Your Score Means
< 15%: Infrastructure-leveraged
Coordination absorption is structurally low relative to labor cost. Governance and routing are largely infrastructure-supported.
15-25%: Coordination-loaded
Coordination load is meaningful and can suppress decision velocity if not continuously managed.
25-35%: Coordination-bound
Coordination overhead is now constraining operating leverage and should be treated as an executive migration priority.
> 35%: Coordination-constrained
Coordination dependency is likely creating structural disadvantage in speed, margin quality, and AI return on investment.
What to Do Next
If your CCR estimate is above 25%, use the diagnostic process to validate the number, map coordination topology, and prioritize governance migration sequencing.